Analytics dashboard
The Analytics dashboard is the top-level surface for reviewing Apple Ads performance in Catchbase. It brings spend, engagement, installs, and revenue into one place and organises them by the four objects you work with every day: campaigns, ad groups, keywords, and search terms. Use it to answer questions about what drove performance over a chosen period.
Before you start
- Apple Ads integration connected.
- MMP integration connected if you want installs and revenue data.
- Admin, Editor, or Viewer role.
The four tabs
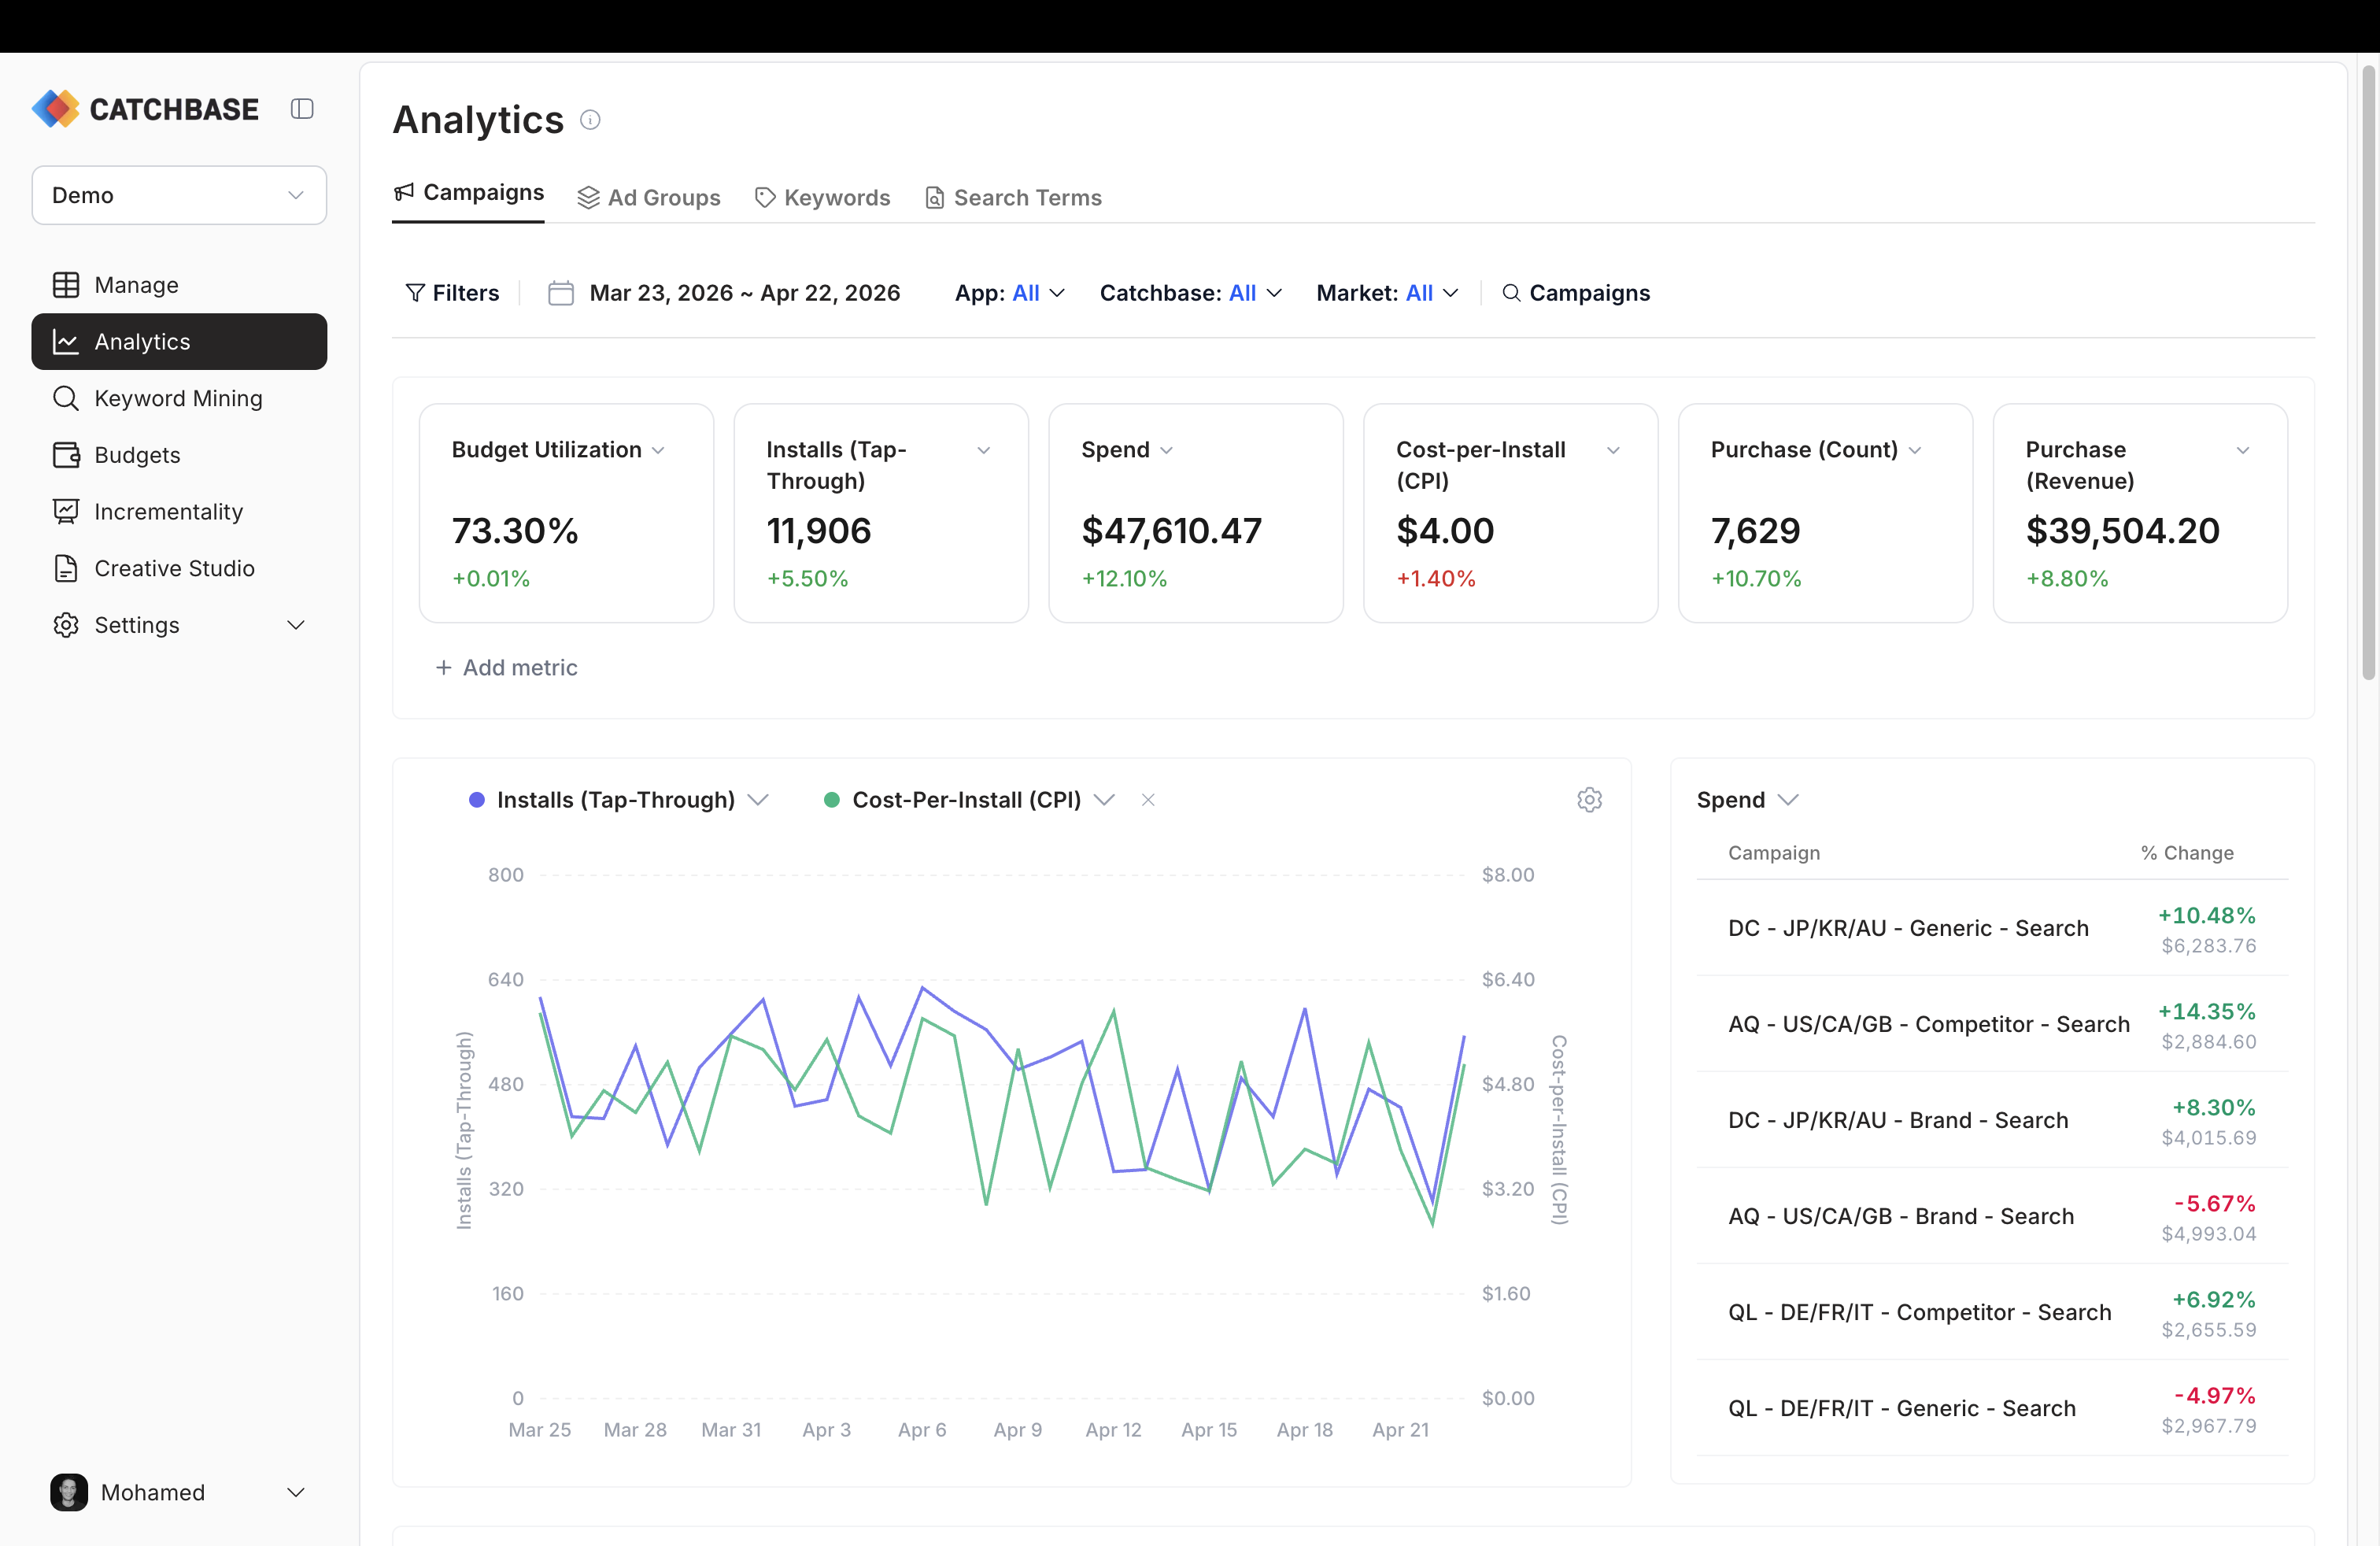
The page opens on the Campaigns tab. Four tabs sit above the filter row and switch the whole view between objects:
- Campaigns summarises performance per campaign. It includes an overall summary card, a performance trends chart, a change-impact panel highlighting the campaigns that moved most compared to the prior period, a campaign-level decision table, and a category and market breakdown.
- Ad Groups summarises performance per ad group, with the same overall card, performance trends, change-impact panel, and a per-ad-group decision table.
- Keywords summarises performance per keyword. It adds a keyword-to-search-term overlap section and a cluster summary view on top of the overall card, trends, change impact, and per-keyword table.
- Search terms summarises performance per search term, with overall, trends, change impact, and a keyword overlap table that ties each search term back to the keywords that matched it.
Every tab reads the same metrics glossary. CPI, CVR, TTR, ROAS, and the cohorted revenue variants are defined once on Metrics glossary.
Date range and filters
The date range picker sits in the filters row and applies to every tab. The default range is the 31 days ending yesterday. Choose a custom range or a preset; the whole dashboard reloads against the new window. Revenue metrics for cohorted windows (D7, D14, D30) trim the most recent N days of install dates from analysis, so very recent date ranges will show smaller cohorted revenue than they will on a later re-load. See Data freshness.
The filter row also carries an App filter, a Market (country) filter, an Ad placement filter, and a Catchbase filter (All, Enabled, Disabled) that narrows the view to campaigns managed by the bidding model. On each tab, the filter matching that tab (campaigns on the Campaigns tab, ad groups on the Ad Groups tab, and so on) is available directly in the row. A "Filters" button opens a modal that groups every available filter together for bulk changes.
How filters work together
Filters are nested. The dropdowns only offer apps, markets, placements, campaigns, ad groups, and keywords that have data in the current date range. As you narrow an upstream filter, downstream options reconcile automatically — selecting an app prunes markets to those where that app runs, and drops campaigns that belong to other apps. The summary card, trends chart, and table on each tab all read the same filter state, so the views stay consistent.